
METR’s AI time-horizon benchmarks rest on 228 tasks. And a 2026 statistical reassessment just recalculated what those numbers actually mean. Researchers reanalyzed results from 228 tasks and 26 AI systems, recomputing time horizons with splines and item-response theory instead of assuming AI task difficulty rises linearly with the logarithm of human completion time (arXiv). The finding that matters most: a jump from 3 minutes to 30 minutes is much easier to achieve than a jump from 30 minutes to 5 hours, even though both are 10x. Same multiplier, very different difficulty. If you’ve been reading time-horizon charts as a forecast for when AI takes over your workload, that forecast just took a real hit.
What the 50% Time Horizon Measures, and What It Doesn’t
METR’s 50% time horizon measures the human completion time of software tasks that an AI solves with 50% probability, which turns capability into units anyone can read: minutes and hours of human work. That definition comes straight from the reassessment paper (arXiv).
METR also published a limitations note containing a sentence that should be stapled to every chart citing this metric: “Time horizon is not the length of time AIs can work independently.” Their wording is that it’s “the amount of serial human labor they can replace with a 50% success rate” (METR).
Most retellings drop both halves.
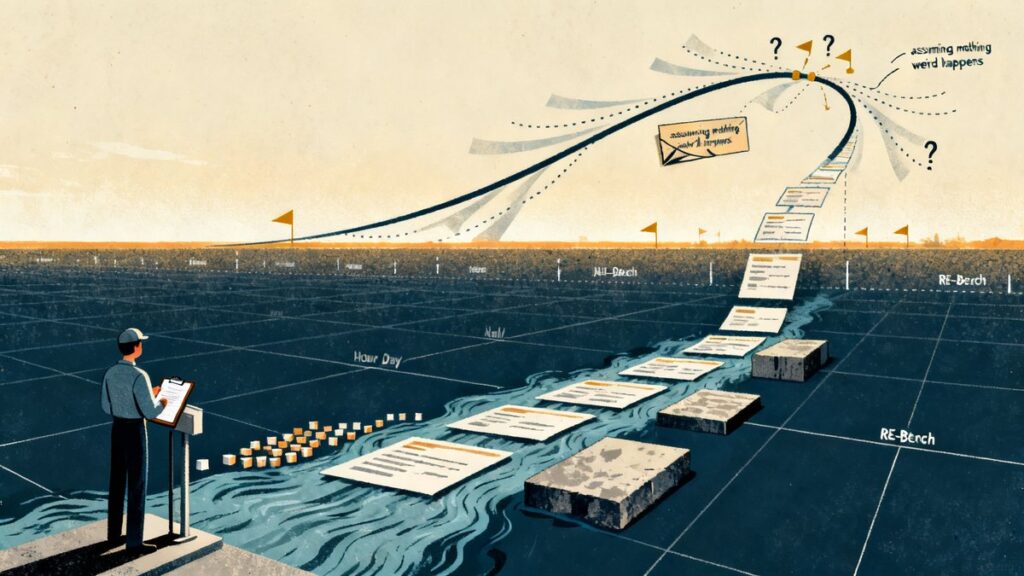
A model with a four-hour horizon doesn’t run unsupervised for four hours; it succeeds on roughly half the tasks a skilled human needs four hours to finish.
That’s a coin flip.
On your specific task, which may be easier or harder than the suite’s average, the odds move.
The Flat Spot That Breaks the 10x Rule
The 2026 paper rebuilt the estimation from scratch across 228 tasks and 26 AI systems, using splines and item-response theory to relax the assumption that a task’s AI difficulty depends linearly on the log of human time (arXiv).
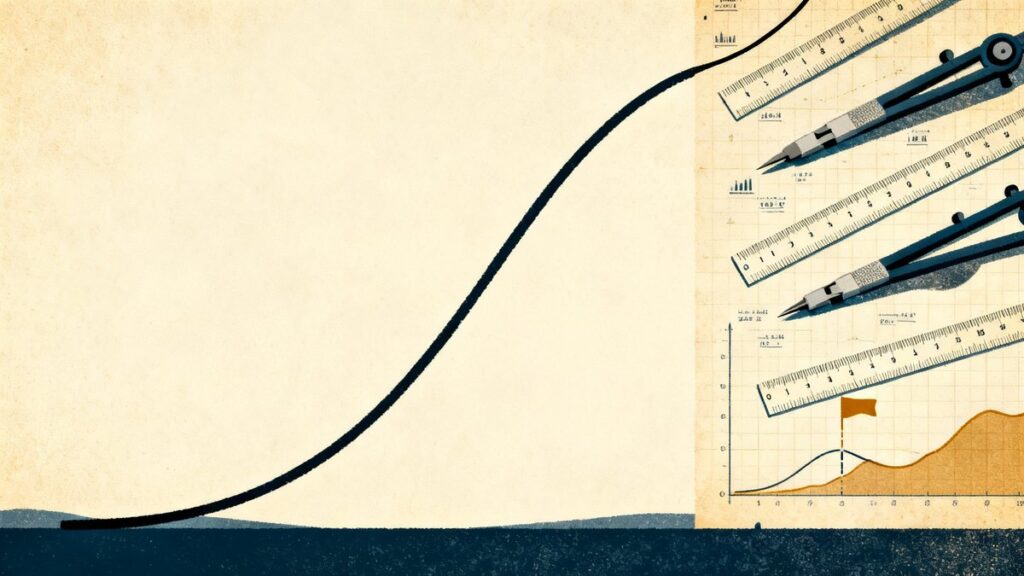
What they found in the data is specific: the fitted spline, which they describe as a function that converts human time to AI difficulty, is nearly flat between 2 and 30 minutes.
And close to linear outside that region.
In plain terms, between 2 and 30 minutes of human time, making a task longer for a human barely makes it harder for an AI. Past that band, difficulty climbs at close to the rate the old model assumed. The consequence they spell out directly: a time-horizon jump from 3 min to 30 min is much easier than one from 30 min to 5 hours despite the same 10x multiplier (arXiv).
Progress through the flat band is cheap. Progress past it is expensive. Any single doubling-time number flattens that texture into one average. And the average hides exactly the part you’d be betting on.
The reassessment isn’t just a takedown.
It contributes point estimates that perform better under a cross-validated suite of proper scoring rules, plus diagnostic plots for assessing the construct validity of time horizons. The authors’ own recommendation is to interpret time horizons together with those diagnostic plots, especially as new time-horizon benchmarks get proposed or existing suites grow longer tasks (arXiv).
The Seven-Month Doubling Time, Reconsidered
The famous number came from earlier work: a 50% time-horizon doubling time of approximately 212 days, or seven months, with a 95% confidence interval of 171 to 249 days (alphaXiv).
The arXiv version described frontier time horizons as doubling roughly every seven months since 2019, with the authors noting the trend may have accelerated in 2024 (arXiv).
METR later analyzed nine benchmarks spanning scientific reasoning, math, robotics, computer use. And self-driving, and observed generally similar rates of improvement to that original seven-month doubling time (METR).
Here’s the uncomfortable connection. That original methodology employed item-response-theory-inspired logistic regression (alphaXiv). The 2026 reassessment exists precisely because the linear-in-log-time assumption behind that model family fails in at least one region of the scale. When difficulty per minute varies by region, a doubling time is a local rate dressed up as a global law. It’s a useful summary.
It is not a countdown timer.
The benchmark itself keeps moving, too. METR released Time Horizon 1.1, using more tasks and a new evaluation infrastructure (METR). And in its May 19, 2026 frontier risk report, METR listed an internal frontier estimate of likely at least 16 hours, with the internal frontier on average about two months ahead of the public frontier in February and March 2026 (METR).
Those frontier claims arrive pre-wrapped in caveats from the same table: the gap was modest. And saturation issues made the conclusions highly uncertain. METR too reported that none of the models shared with it were significantly more capable than the strongest publicly documented models as of May 19, 2026. That’s what honest measurement looks like. It’s the opposite of how the numbers travel once they hit a headline.
What This Means If You Delegate Real Work
I ship AI automation every day. And the operating rule I take from all of this is simple: never convert a published horizon into unattended runtime. Convert it into a success rate you have to verify. The metric is a 50% success probability on human-timed tasks. So anything an agent produces gets checked, the same way you’d check a junior hire’s first drafts.
Second rule: build your own curve.
Pick your ten most repeated tasks, time how long each takes you, run each against the model you actually pay for, and record the wins.
Ten data points on your real work beat a fitted spline across 228 tasks that aren’t yours.
You’ll learn more about your automation ceiling in one afternoon than from any doubling-time chart. And you’ll learn it in units that map to your invoices.
Third rule: interrogate the provenance.
When a vendor or a LinkedIn post cites a horizon number, ask which suite and which version produced it.
TH1.1 exists since the task mix and evaluation infrastructure changed the estimates (METR).
A horizon from an older suite is a other measurement, not a slower reading of the same one.
The Takeaway
This reassessment isn’t bad news for the field. It’s the benchmark growing up. Researchers relaxed their own assumptions, published better-scoring estimates. And told everyone to read the diagnostics alongside the headline number (arXiv). What breaks is the telephone game downstream, where a 50% success rate becomes “works unsupervised for hours” and a regional difficulty curve becomes Moore’s Law for agents.
Small operators don’t need to forecast the frontier. You need to know what you can hand off this month without checking every line. So before you give an agent a four-hour task, give it a 30-minute slice ten times and count the wins. That ratio is the only time horizon that pays your bills.